Australian Farm Institute briefing paper Australian farm supports
Key points:
Australian farmers receive some of the lowest government assistance and support globally, both in terms of PSE and TSE;
OECD indicator calculations include Australia’s policies for drought assistance and risk management mechanisms, helping Australian farmers manage extreme climate variability;
Of the small amount of support Australian farmers do receive, over 50% is GSSE (based on 2016-18 data), meaning support is provided via policies which benefit the industry through RD&E and infrastructure;
High levels of subsidies and support in competitor countries are having significant economic impacts on Australian agriculture, and the broader economy, through reduced on-farm incomes and farm exports; and
Accurate representation of Australian agriculture’s position is vital to ensure sound domestic policy development, just trade negotiations and ongoing market access.
Subsidised agriculture around the world: the impact on Australia
Australian agriculture is a highly globalised industry, with 71% of all production being exported (ABARES, 2020). This global exposure means that economic, trade and political factors in other countries can have significant impacts on the operations and profitability of Australian farmers and the industry. These impacts are exacerbated as Australian farmers receive very little government support relative to other countries.
Recent events, including COVID-19 disruptions to supply chains, have amplified the effects of uncertainty in the global market on Australian agriculture. For example, the allegation that Australia has been dumping barley into China and providing countervailing subsidies to farmers could damage a trade relationship which was worth $1.5 billion in 2018, despite a lack of evidence for the claim.
Accurate representation of Australian agriculture’s position on the global playing field is vital to ensure just trade negotiations and underpin ongoing market access. This briefing paper outlines the very low levels of support Australian farmers receive relative to other countries, using data from the Organisation for Economic Co-operation and Development (OECD), and highlights some implications for the agricultural sector and trade positions.
How does Australia compare to other countries?
The OECD (2020) collects data to provide regular updates and estimates on the levels of farm support provided in countries around the world, defining agricultural support as:
“the annual monetary value of gross transfers to agriculture from consumers and taxpayers arising from government policies that support agriculture, regardless of their objectives and economic impacts.”
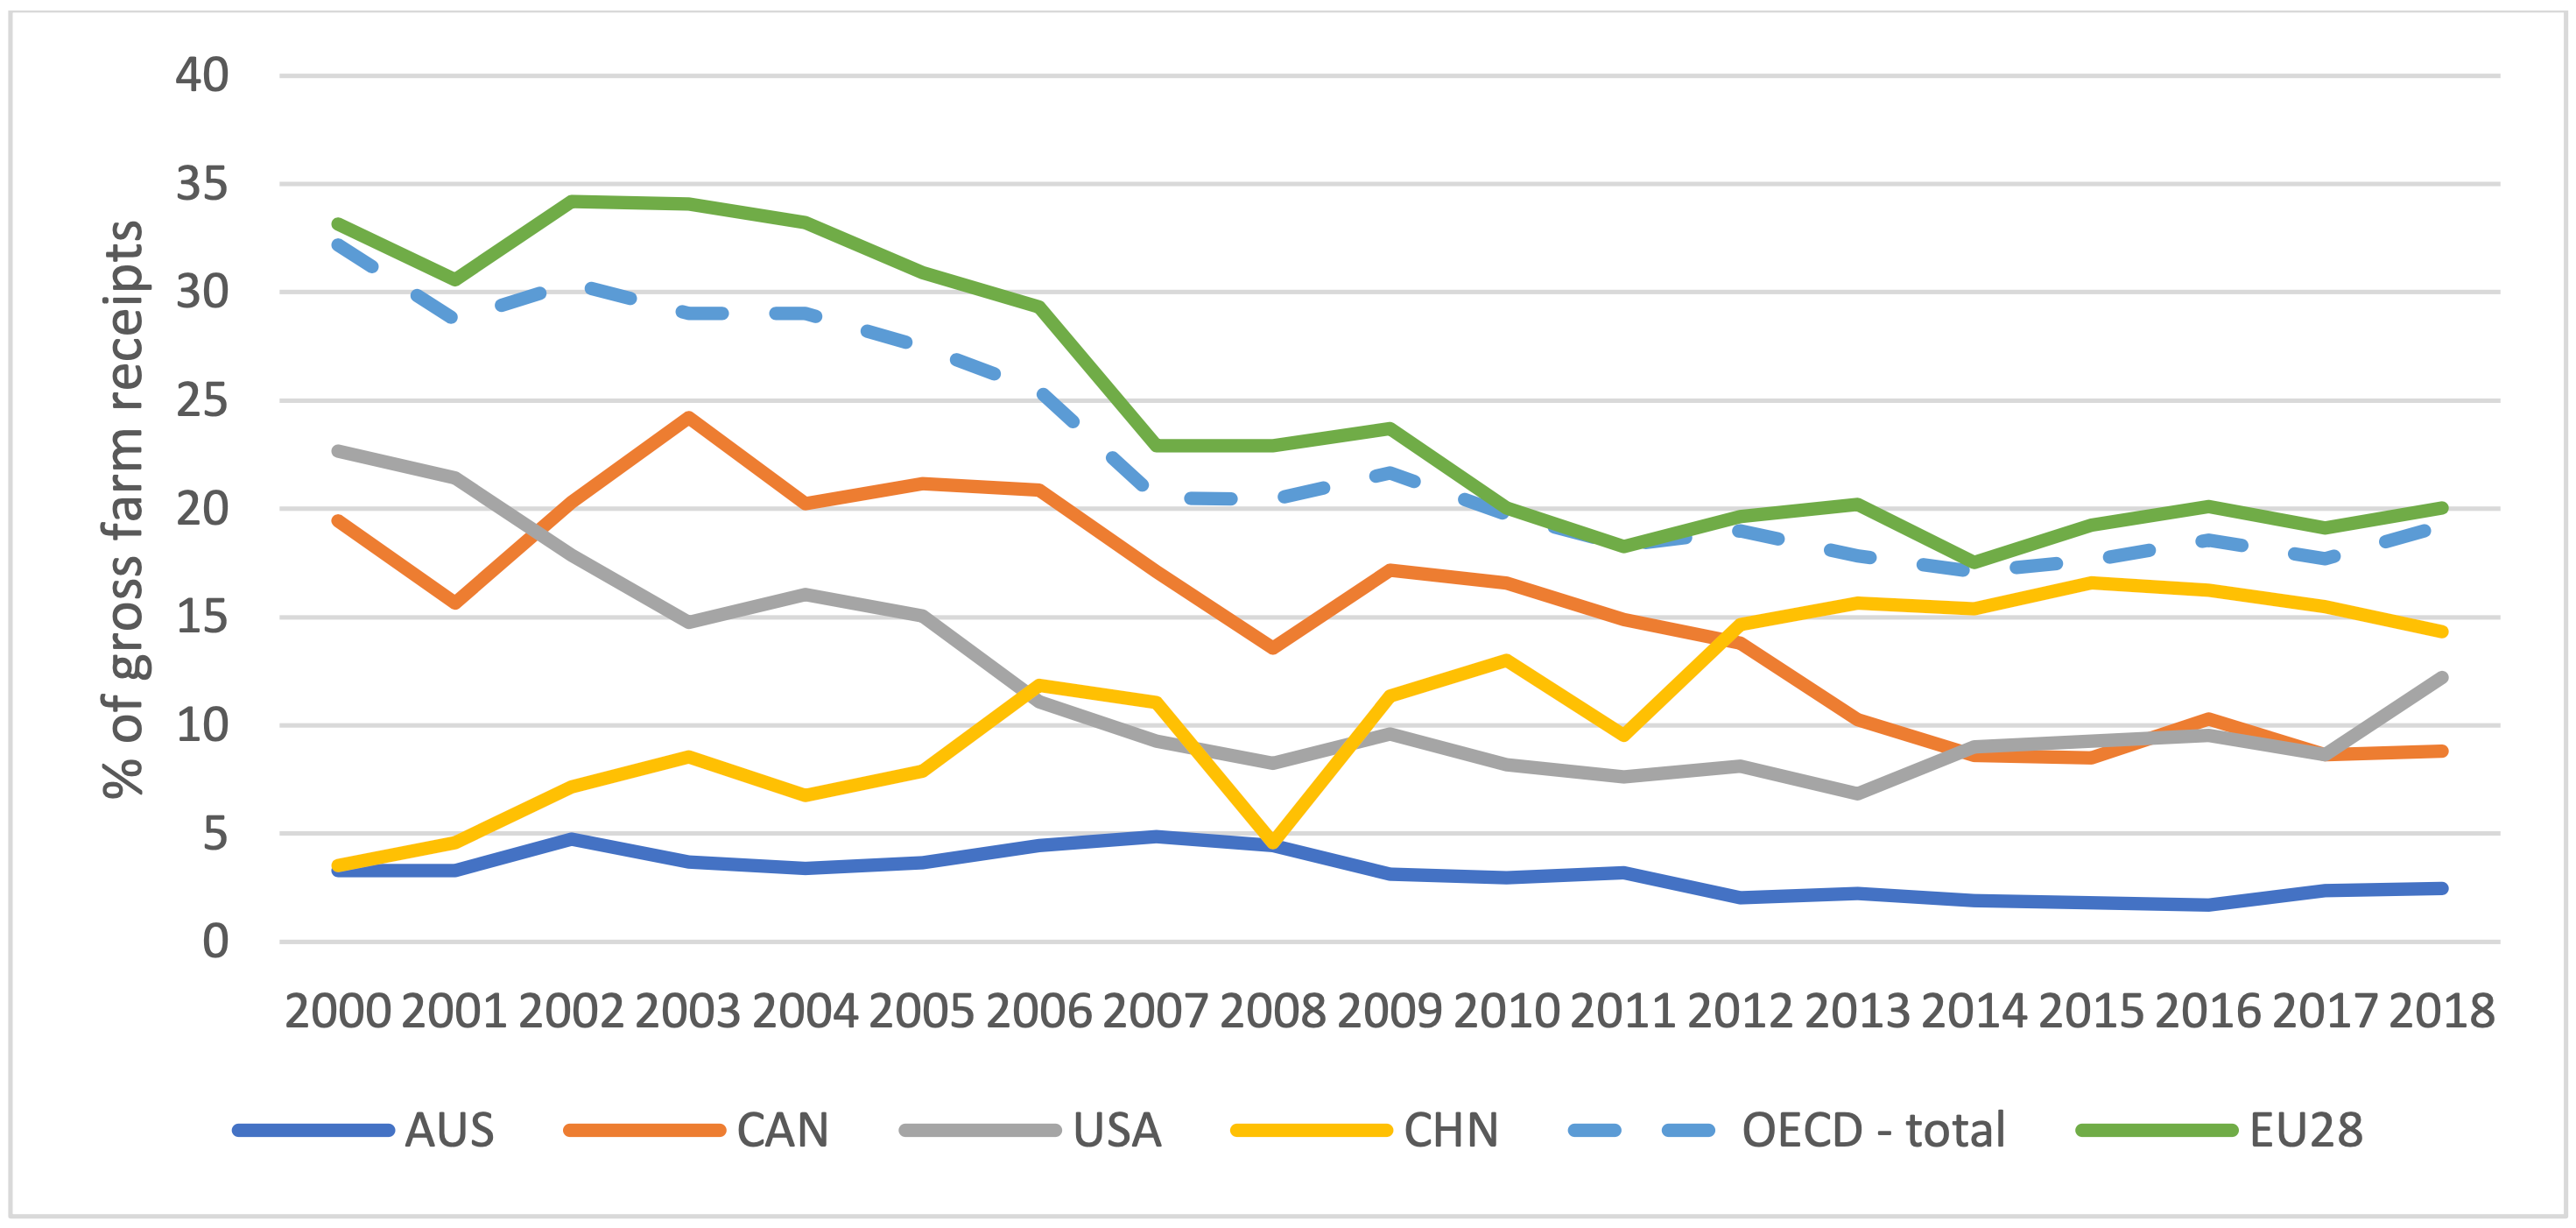
Figure 1 graphs the Producer Support Estimate1 (PSE) of Australia, Canada, the United States, China and the EU from 2000-18 as a percentage of gross farm receipts. Over this time period Australian farmers have received an average of 3% of their gross farm income as support, while Canada has averaged 15%, USA 12%, China 11% and European farmers have received 25% as support. Australia’s PSE is the second-lowest (just behind New Zealand) of countries monitored by the OECD, and has been steadily reducing over the past two decades. Indeed, across the Australian economy the inexorable reduction in government protection for some key parts of industry has resulted in the effective rate of assistance for the agriculture and manufacturing sectors reaching an historic low (Productivity Commission, 2020).
Figure 1: Producer support estimate (PSE) by Country, 2000-18 Source: (based on OECD, 2020)
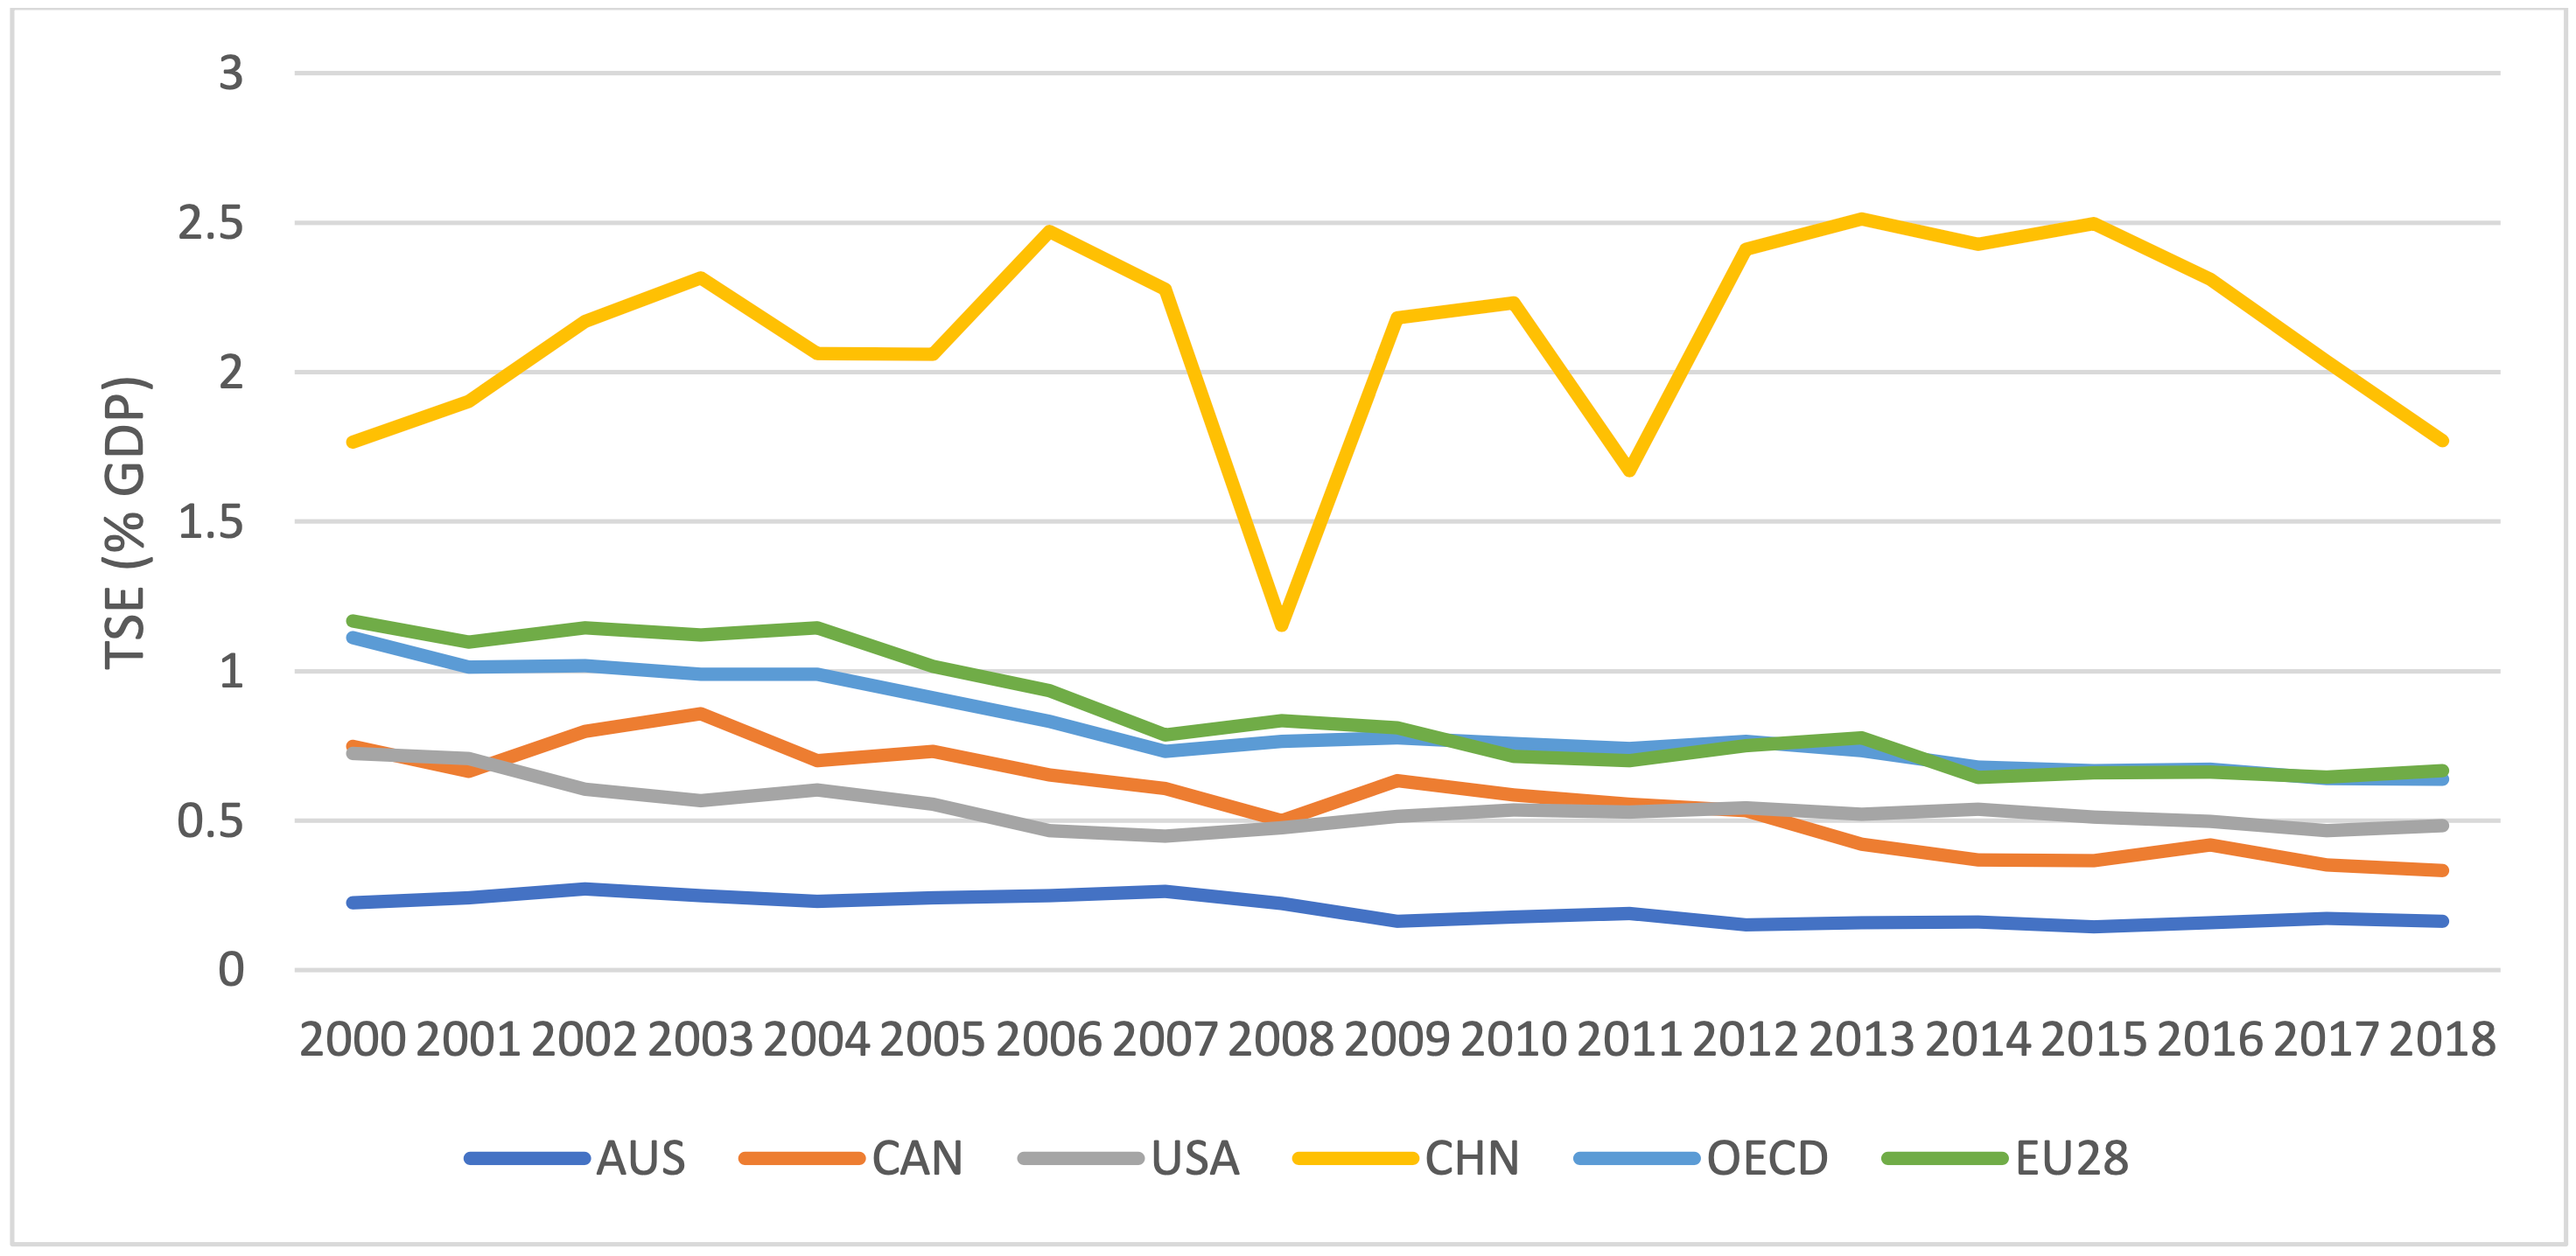
The Total Support Estimate (TSE2 ) provided to agriculture sectors in the same countries (which includes transfers other than direct payments to farmers) shown in Figure 2 again demonstrates the extremely low level of comparative support provided to Australian agriculture. In fact, since 2009 no more than 0.19% of Australia’s annual GDP has been provided as support to the agriculture sector. Australia has the lowest TSE of any country monitored by the OECD.
Figure 2: Total support estimate (TSE) by country, 2000-18 Source: (OECD, 2020)
What support do Australian farmers receive?
The small percentage of farm gate revenue provided to Australian farmers included in the PSE is entirely in the form of to what the OECD defines as ‘input use’ support, which includes droughtassistance measures such as concessional interest rates on loans for upgrading on-farm water infrastructure and equipment. The remaining direct support Australian producers receive is aimed at managing risk through mechanisms such as farm management deposits and income tax averaging arrangements (OECD, 2019).
Industry support, such as expenditure on agricultural research, development and extension (RD&E) and infrastructure, as well as smaller levels of inspection, control, marketing and promotion, is measured by the OECD through the general services support estimates (GSSE) indicator. A comparison between different countries of the proportion of total support (TSE) that is provided as GSSE again highlights the very low levels of direct support to farmers in Australia.
In 2016-18, approximately 55% of Australia’s agricultural TSE was made up of GSSE. In the same period, GSSE in countries with more intensive direct farmer support policies accounted for a much smaller approximate percentage of total TSE (e.g. China 15%; US and EU both 10%), indicating a greater proportion of direct (non-RD&E related) support such as minimum prices on specific commodities.
Implications of global farm support policies
Anderson & Valenzuela (2020) have calculated that Australian annual farm exports were reduced by 29% ($10.4 billion) and net incomes of Australian farms lowered by 15% ($6.1 billion)3 in 2014 due to the support policies for farmers in other countries. The primary impact on Australian agriculture calculated in this report (75%) was attributed to protectionist policies of China, the EU, Korea and Japan, which (along with Indonesia and the US) have some of the highest levels of support for their farmers.
Market price support (MPS) mechanisms through import barriers (tariffs) or minimum price support for specific commodities, are a common form of government intervention utilised globally. In its annual Agricultural Policy Monitoring and Evaluation (Vojtech, 2019), the OECD lists multiple countries (including Brazil, China, Japan and Israel) for which MPS is still the most significant component of producer support. Artificial price signals delivered through MPS lead to production decisions which are not reflective of true supply and demand issues, creating market distortions which undermine and threaten Australia’s trade competitiveness.
GrainGrowers CEO David McKeon said Australian farmers are clearly being negatively affected by the support policies received by their counterparts across the globe.
“Australian grain farmers operate in highly competitive international markets; they face the full exposure of market volatility and localised climate variability,” Mr McKeon said.
“With Australian farmers receiving less government support than all their international competitors, it is critical that we get policy settings right. Our government policy settings on trade, RD&E, infrastructure and regulation are fundamental to our ongoing international competitiveness.”
Australian Farm Institute Executive Director Richard Heath said in times of uncertainty it is more important than ever to ensure that policy decisions are based on evidence, not conjecture.
“Australian agriculture is facing a range of current market access challenges, whether they be for pulses into India or barley into China, and we need to base our discussions on the facts and also clearly understand the ramifications on Australian, and indeed farmers across the globe, from such policy decisions,” he said. China’s threat to impose tariffs that would effectively end Australian barley sales based on an unsupported allegation of subsidisation is a clear example of the need to present data clearly and dispassionately.
“Industry credibility comes from transparency and authenticity,” Mr Heath said. “This credibility is essential to maintain mutually beneficial trade relationships, and for this parties must engage in evidence-based discourse.”
Mr McKeon noted that with improved seasonal conditions in many of Australia’s cropping regions, the grains industry has the potential to provide the green shoots of economic recovery as Australia emerges from current challenges.
“To achieve this, our industry needs an ambitious trade policy agenda and a continual focus on reductions in unnecessary red tape,” he said.